How QA Engineers Write Bug Reports Developers Can Actually Reproduce
Learn how QA engineers write bug reports developers can reproduce on the first pass, combining DOM context, console telemetry, and searchable video walkthroughs.

How QA Engineers Write Bug Reports Developers Can Actually Reproduce
The most frustrating status on a bug ticket is "Closed: Cannot Reproduce." It slows sprint progress, triggers defensive messaging, and leaves real software defects in production.
This usually happens because written steps leave out the runtime state. Describing a dynamic bug in text often misses the micro-actions, background data, and timing that caused the break. A good bug report is not a long written explanation. It is a clear, step-by-step record of the system state when it broke.
The Reproducible Bug Standard
Check Pre-Conditions: Note user roles, feature flags, browser details, and local storage state.
Trim Extra Steps: Reset the session and record only the actions needed to trigger the bug.
Name Exact UI Elements: Point to specific buttons, selectors, or API endpoints instead of general screen areas.
Add System Data: Include console errors, failed network status codes, and browser versions.
Use Searchable Media: Share walkthroughs that let developers search actions and copy text directly from the recording.
Why "Cannot Reproduce" Happens
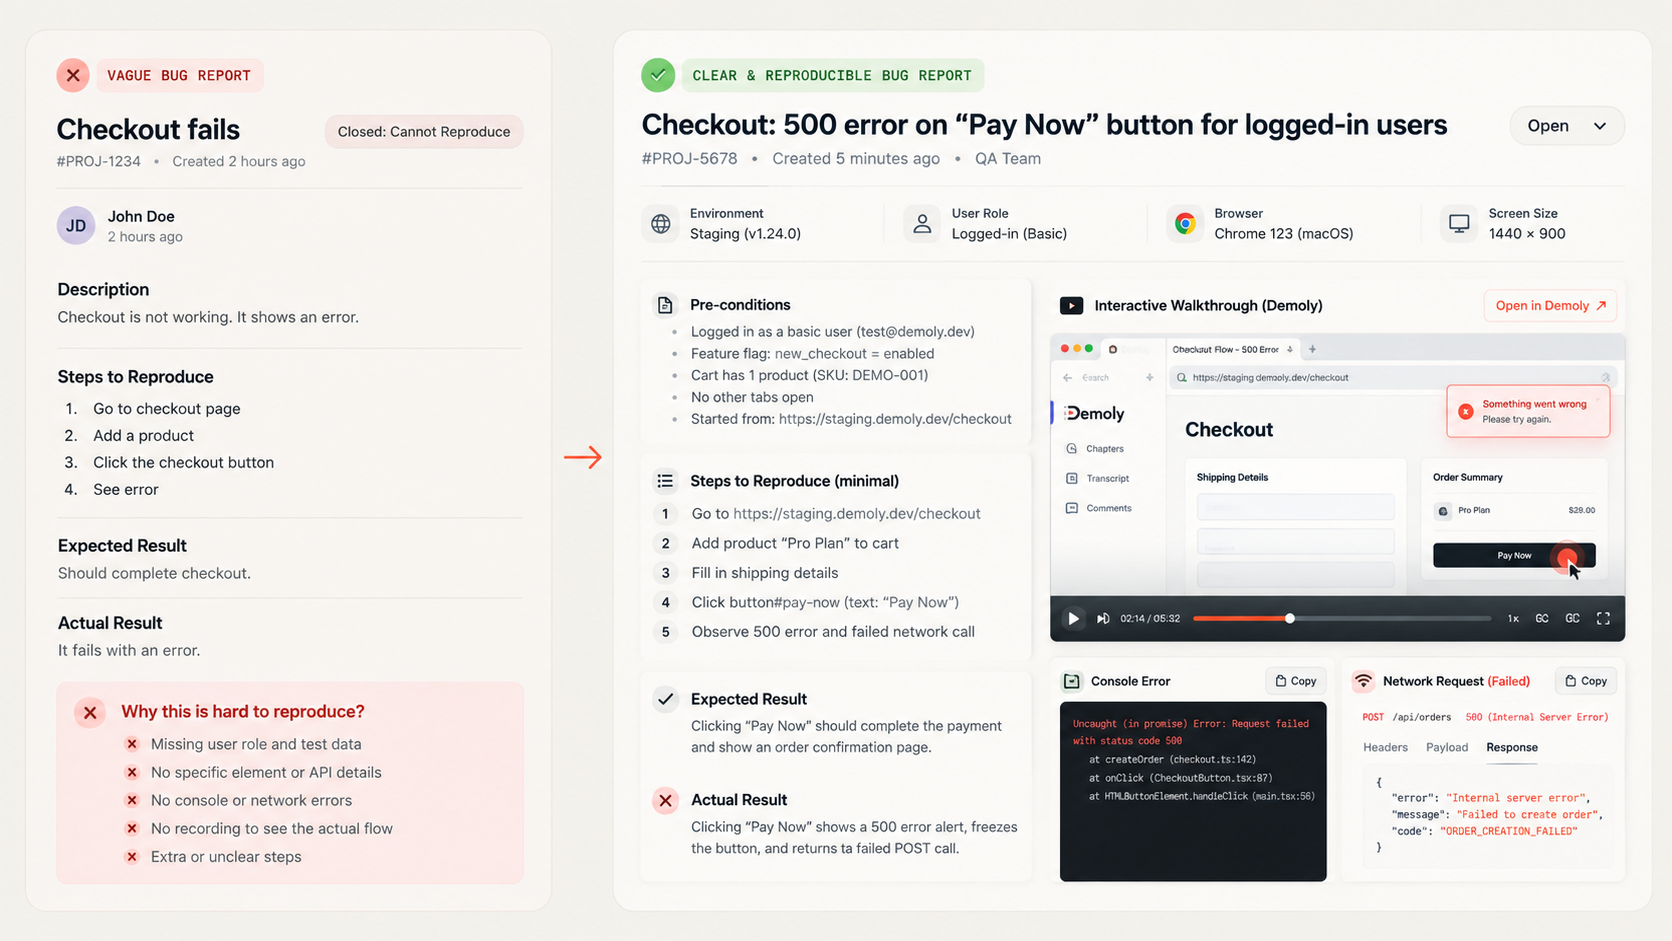
When a developer closes a ticket without fixing it, the issue usually stems from three common gaps in the report:
Missing Setup Details: You tested the app on an account with specific permissions, an active feature flag, and saved browser data. The developer then tests on a clean local setup with admin access and never hits the broken rule.
Vague Interface Targets: Written steps often say things like "click the top blue button." In modern apps with nested tabs, duplicate buttons, or pop-up modals, the developer cannot tell which element you clicked.
Unrecorded Silent Actions: Testers often take quick, quiet actions without thinking about them. You might clear an input box, switch tabs, or close a menu before submitting a form. If those small actions are missing from the report, the developer cannot recreate the exact issue.
5 Steps to Clear Bug Reporting
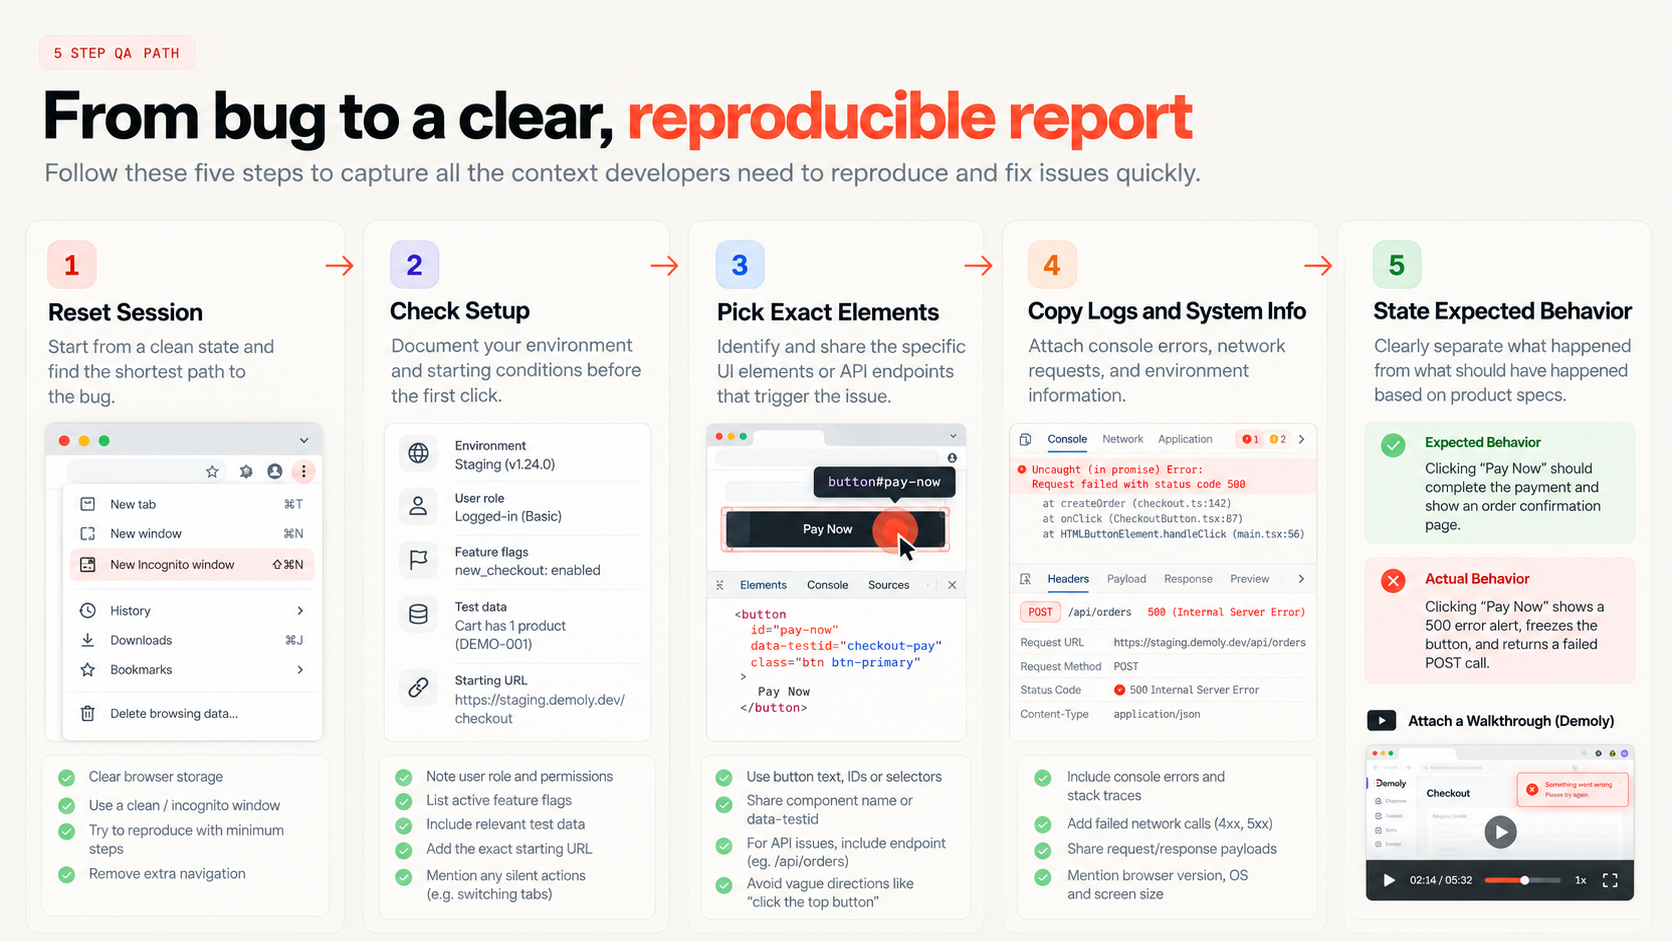
Follow these five practical steps to help developers isolate and fix bugs on the first pass:
1. Find the Shortest Path to the Bug
Do not write out your whole testing session. Once you find a bug, clear your browser storage, open a clean window, and try the steps again. Find the fewest clicks needed to trigger the error. Removing extra navigation helps developers spot the problem in the code faster.
2. Note Starting Conditions and Silent Actions
Reproduction starts before the first click. Record the state of the app before step one:
What user role and permission level are logged in?
What test data is already saved in the account?
What URL did you start on?
Did another tab or an earlier form input change the local state?
If you took an action silently without changing text on screen, add it to the steps.
3. Point to Exact Elements
Avoid general visual directions. Instead of writing "click save," inspect the page and share the component name, button text, or selector, such as `button#save-profile-btn` or `data-testid="billing-submit"`. This tells the developer which click event or function failed to run.
4. Include Logs and System Info
A visual bug often leaves behind helpful system data. Open Developer Tools and grab:
Console errors and stack traces.
Failed network calls, including status codes (4xx, 5xx) and response data.
Browser version, operating system, and screen size.
Adding console and network data turns a surface-level visual glitch into a clear diagnostic clue.
5. Separate Expected from Actual Behavior
Never assume the intended behavior is obvious. Clearly separate what actually happened from what should have happened based on product specs:
Actual Result: "Clicking 'Generate API Key' shows a 500 error alert, freezes the button, and returns a failed POST call with status 500."
Expected Result: "Clicking 'Generate API Key' should show the new key in the input box and save it to the dashboard."
What Makes an Effective Bug Report Ticket
A clear bug ticket removes guesswork by grouping technical context into predictable fields. When an issue tracker layout clearly separates starting state, reproduction actions, and error telemetry, developers can jump straight into testing instead of asking for clarification.
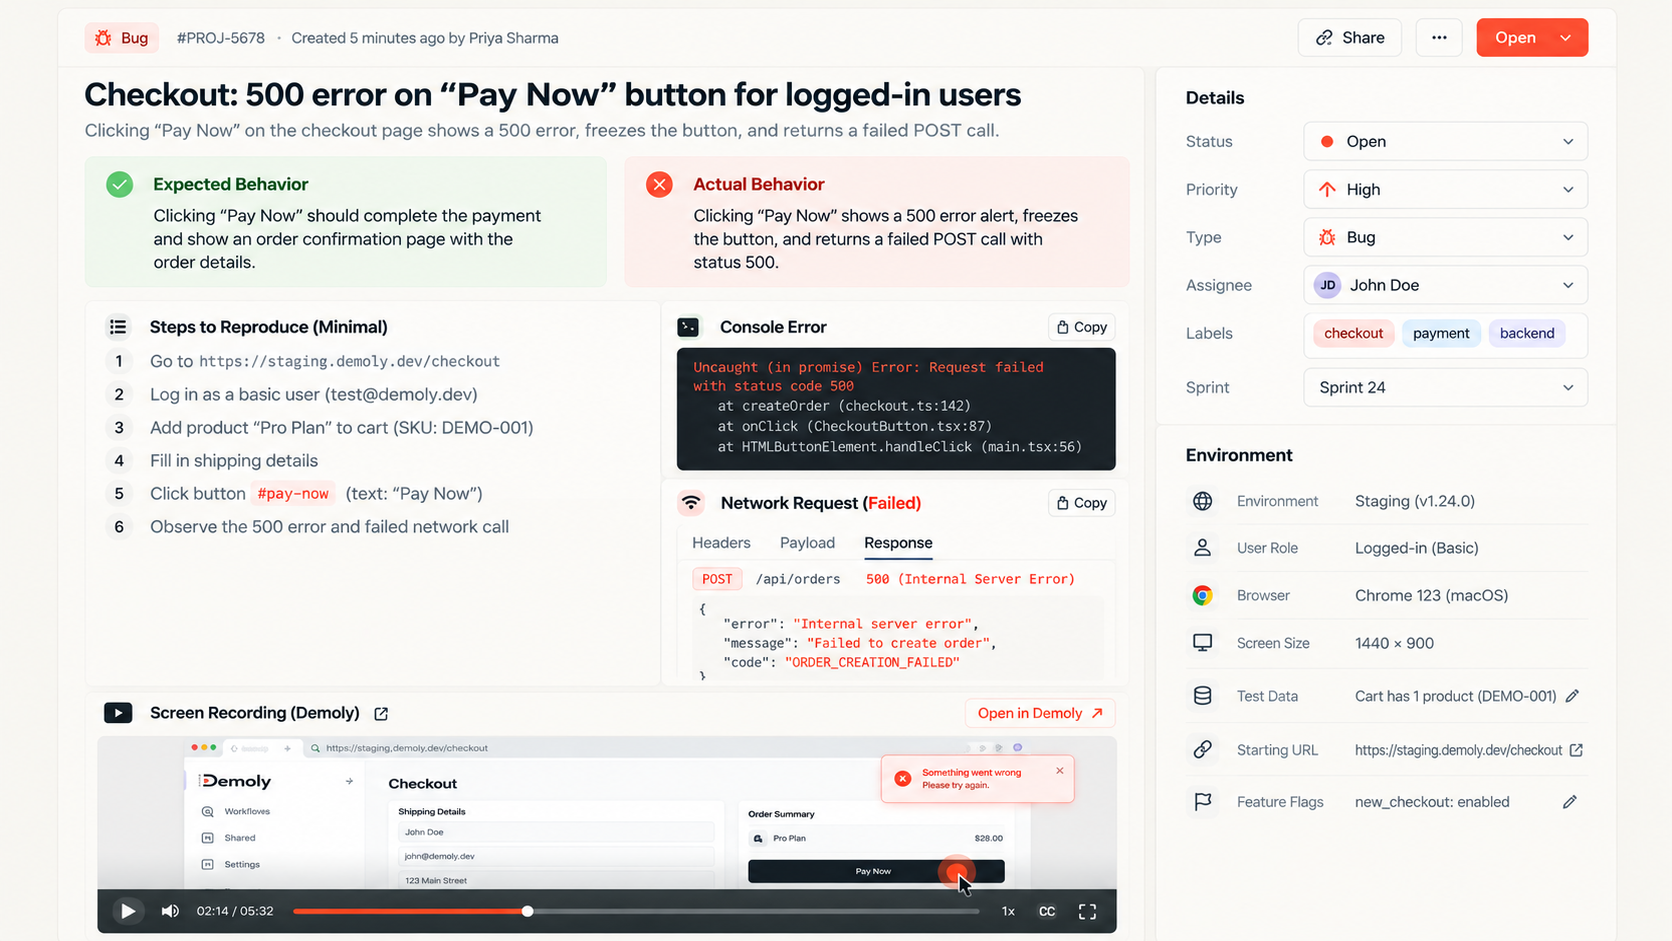
This layout works well because every section serves a dedicated purpose:
Action-Driven Summary: The title states the exact failure, the component involved, and the condition that caused it.
Complete Environment Setup: It lists the staging build version, user role, active feature flags, and browser specifications upfront.
Minimal Reproduction Sequence: The steps contain only the clicks and keystrokes required to produce the bug, with specific element names rather than vague screen locations.
Unambiguous Results: The expected and actual behaviors are kept apart, making the defect obvious against product acceptance rules.
Diagnostic Telemetry: It pairs visible application behavior with the exact console error and failing HTTP payload from network tools.
Visual Proof: An attached recording shows the entire failure sequence in real time, capturing timing and silent actions that text alone might skip.
Comparing Documentation Formats
The format you use to share context affects how fast a developer can debug the issue:
Text and Screenshots: Written reports are easy to read, but they take a long time to write and annotate. They also tend to leave out small actions that trigger race conditions.
Standard Video Recordings: Standard screen recorders like Loom make capturing an issue quick. But flat video files force developers to scrub back and forth to find the right frame. Because standard tools only search spoken transcripts, actions done in silence stay hidden. You also cannot copy error messages or code from standard video frames.
Searchable Walkthroughs: Modern walkthrough tools like Demoly turn screen recordings into searchable guides. Demoly indexes both audio and on-screen clicks. If you silently click an obscure menu or type an unusual input string, those actions remain searchable. A developer can ask, "What was entered before the 500 error?" and jump straight to that moment.
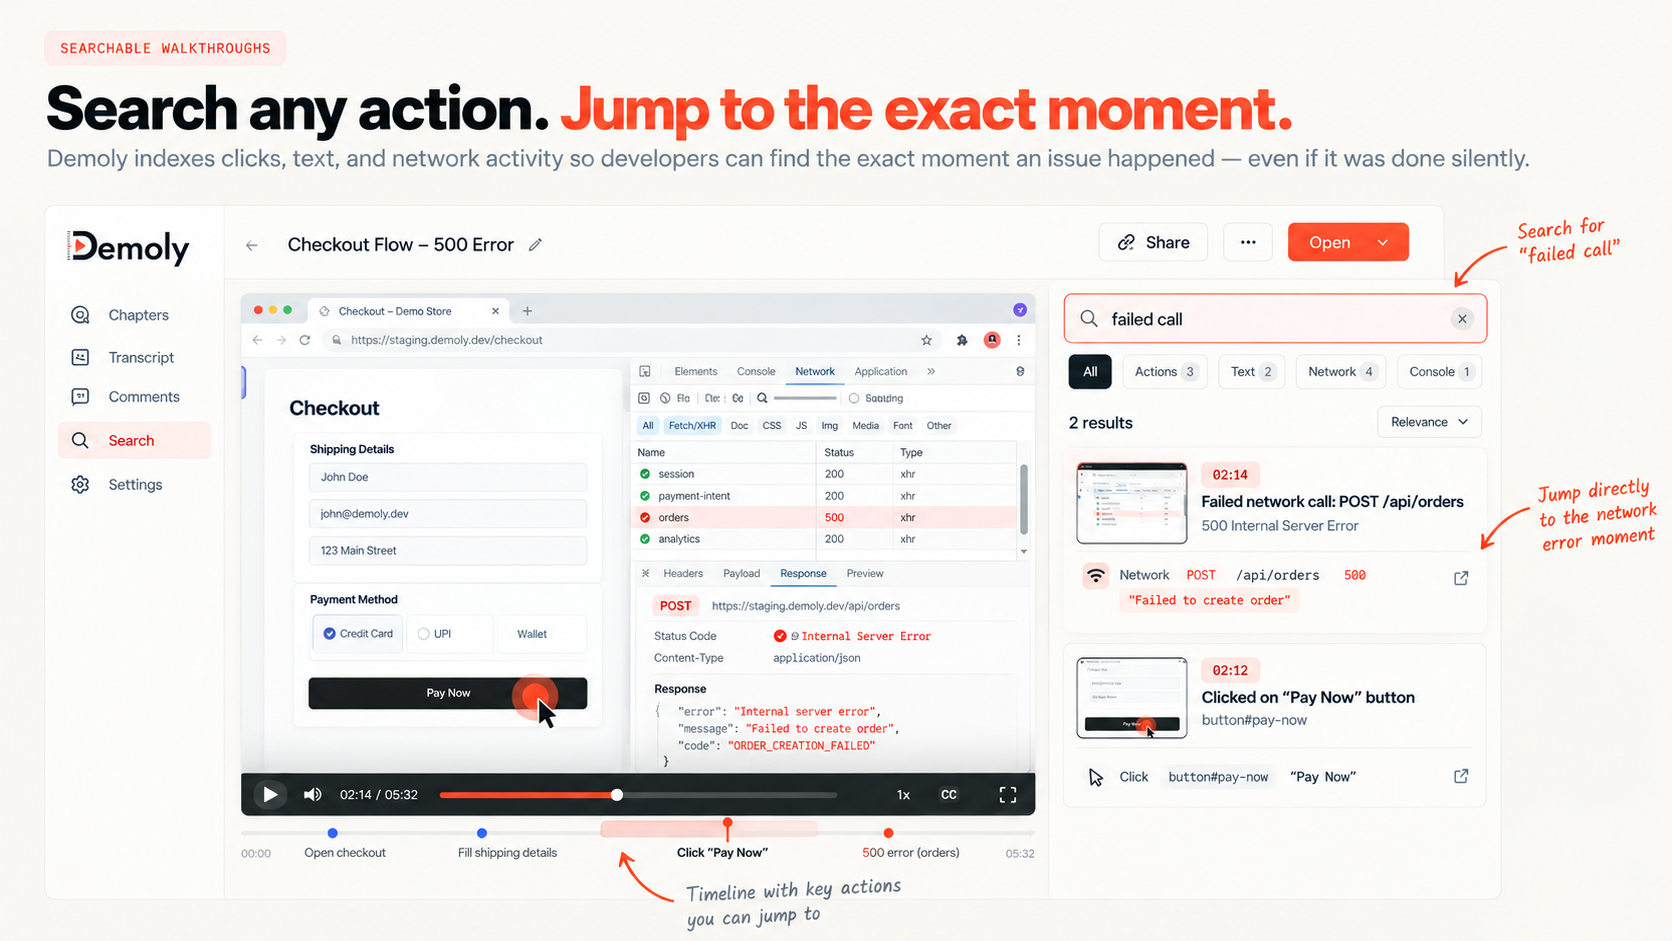
Using Demoly for Faster Bug Reporting
You do not need to replace your current issue tracker. Jira, Linear, and GitHub remain your team's home base, while Demoly provides the visual context attached to each ticket.
With the Demoly browser extension, QA engineers can capture bugs across browser tabs without lag:
1. Record the Issue: Record the bug as it happens in your browser. Demoly records your screen while tracking clicks, page changes, and tab switches.
2. Tag Exact Elements: Instead of adding vague text callouts, attach notes directly to specific UI components and buttons in the recording.
3. Hide Sensitive Data: If your test setup shows user details, private keys, or credentials, use canvas redaction to permanently remove that data from the recording before sharing.
4. Share the Link: Paste the recording link into your ticket. The developer can open it in any browser without needing to install extensions or create an account. They can search actions or highlight and copy error text directly from the video frame.
Frequently asked questions
Commonly asked questions about this article.
01•Can developers copy error text directly from a Demoly video?
Yes. Demoly lets developers select and copy code, logs, and error text straight from a paused video frame.
02•Why do silent actions matter in bug reports?
Testers often clear inputs, switch tabs, or close menus without speaking. Indexing silent clicks ensures these vital reproduction steps are not lost.
03•Do developers need an account to view a Demoly recording?
No. Links open in any standard browser without requiring sign-ups, seats, or extensions.
04•How does Demoly keep test credentials private?
Demoly provides permanent canvas redaction, allowing you to remove sensitive keys and data directly from the video before generating a share link.
05•Does Demoly replace Jira or Linear?
No. Demoly provides the visual context and logs that you paste directly into your existing Jira or Linear tickets.

Team Demoly
Contributing author covering precision walkthroughs and modern product engineering at Demoly.
Related Dispatches
View all dispatches →
Loom vs Vidyard: Which Is Better for Tech Agencies?
Compare Loom and Vidyard for tech agencies. Discover how screen capture, CRM tracking, video analytics, and client handoff workflows compare in practice.

Supademo vs Demoly: Interactive Demos vs AI-Searchable Walkthroughs
Compare Supademo and Demoly to choose between synthetic click-through demo tours and AI-searchable browser video walkthroughs for client handoffs and product guides.

Best Loom Alternatives for Tech Agencies
Looking for Loom alternatives for your tech agency? Compare the 6 best tools for client handoffs, AI-searchable walkthroughs, QA bug reporting, and interactive documentation.
 Team Demoly
Try Demoly for your team
Create branchable, interactive demo recordings and deliverables in minutes with zero friction.